Visualizations Archives
Interactive Glass Wall Project
A proof-of-concept for a next generation interface for the launch Firing Room at Kennedy Space Center.
The GVIS Lab has created a proof-of-concept for a next generation, natural user interface for controlling the display of camera imagery and sensor data gathered from the launch pads at Kennedy Space Center. The interface is useful for real-time views of a spacecraft right before launch (for detecting issues, checking that things work, etc.) The proof-of-concept makes use of a massively multi-touch screen which allows for collaboration with multiple users.
The goal of the project was to contribute to meeting NASA’ objective to facilitate and utilize U.S. commercial capabilities to deliver cargo and crew to space.
Augmented Reality Tablet Display of NASA Concept Vehicles
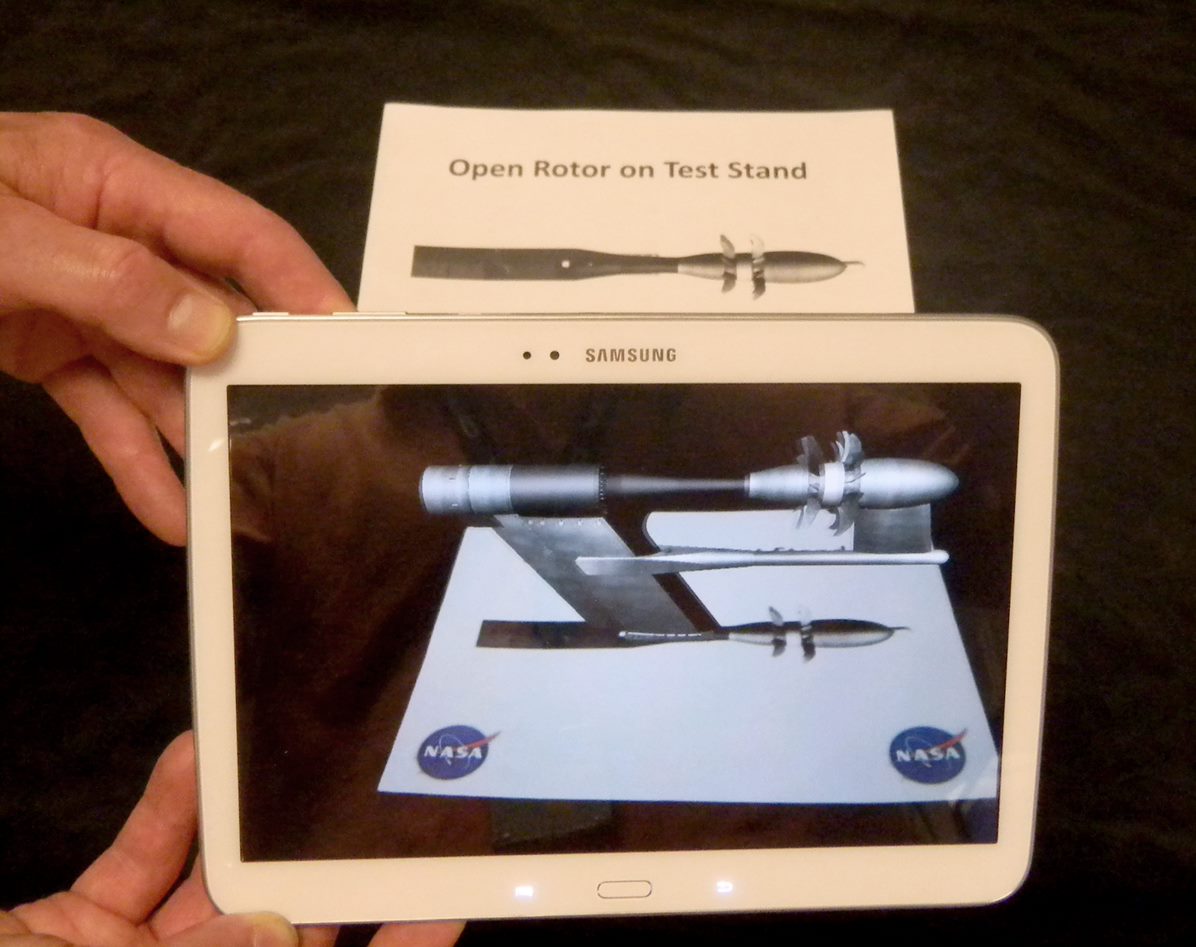
This is an Android augmented reality app that displays a pre-programmed 3D model version of a few NASA concept aircraft and a jet engine. The user points the tablet at one of the 2D paper versions of the models and then can explore the 3D model that pops up above the paper. The size and position of NASA logos on each sheet is unique; they are used by the app to identify the target it sees and “anchor” the 3D model’s position. You can tap the models to flip them, or to rotate the blades (changing speed and direction) for the open rotor jet engine. The application displays models for:
- Open rotor engine
- Turbo Electric Distributed Propulsion concept aircraft
- D8 Double Bubble Concept Aircraft
- “SUGAR High” Truss Braced Wing Concept
zSpace NASA Concept Vehicle Visualization
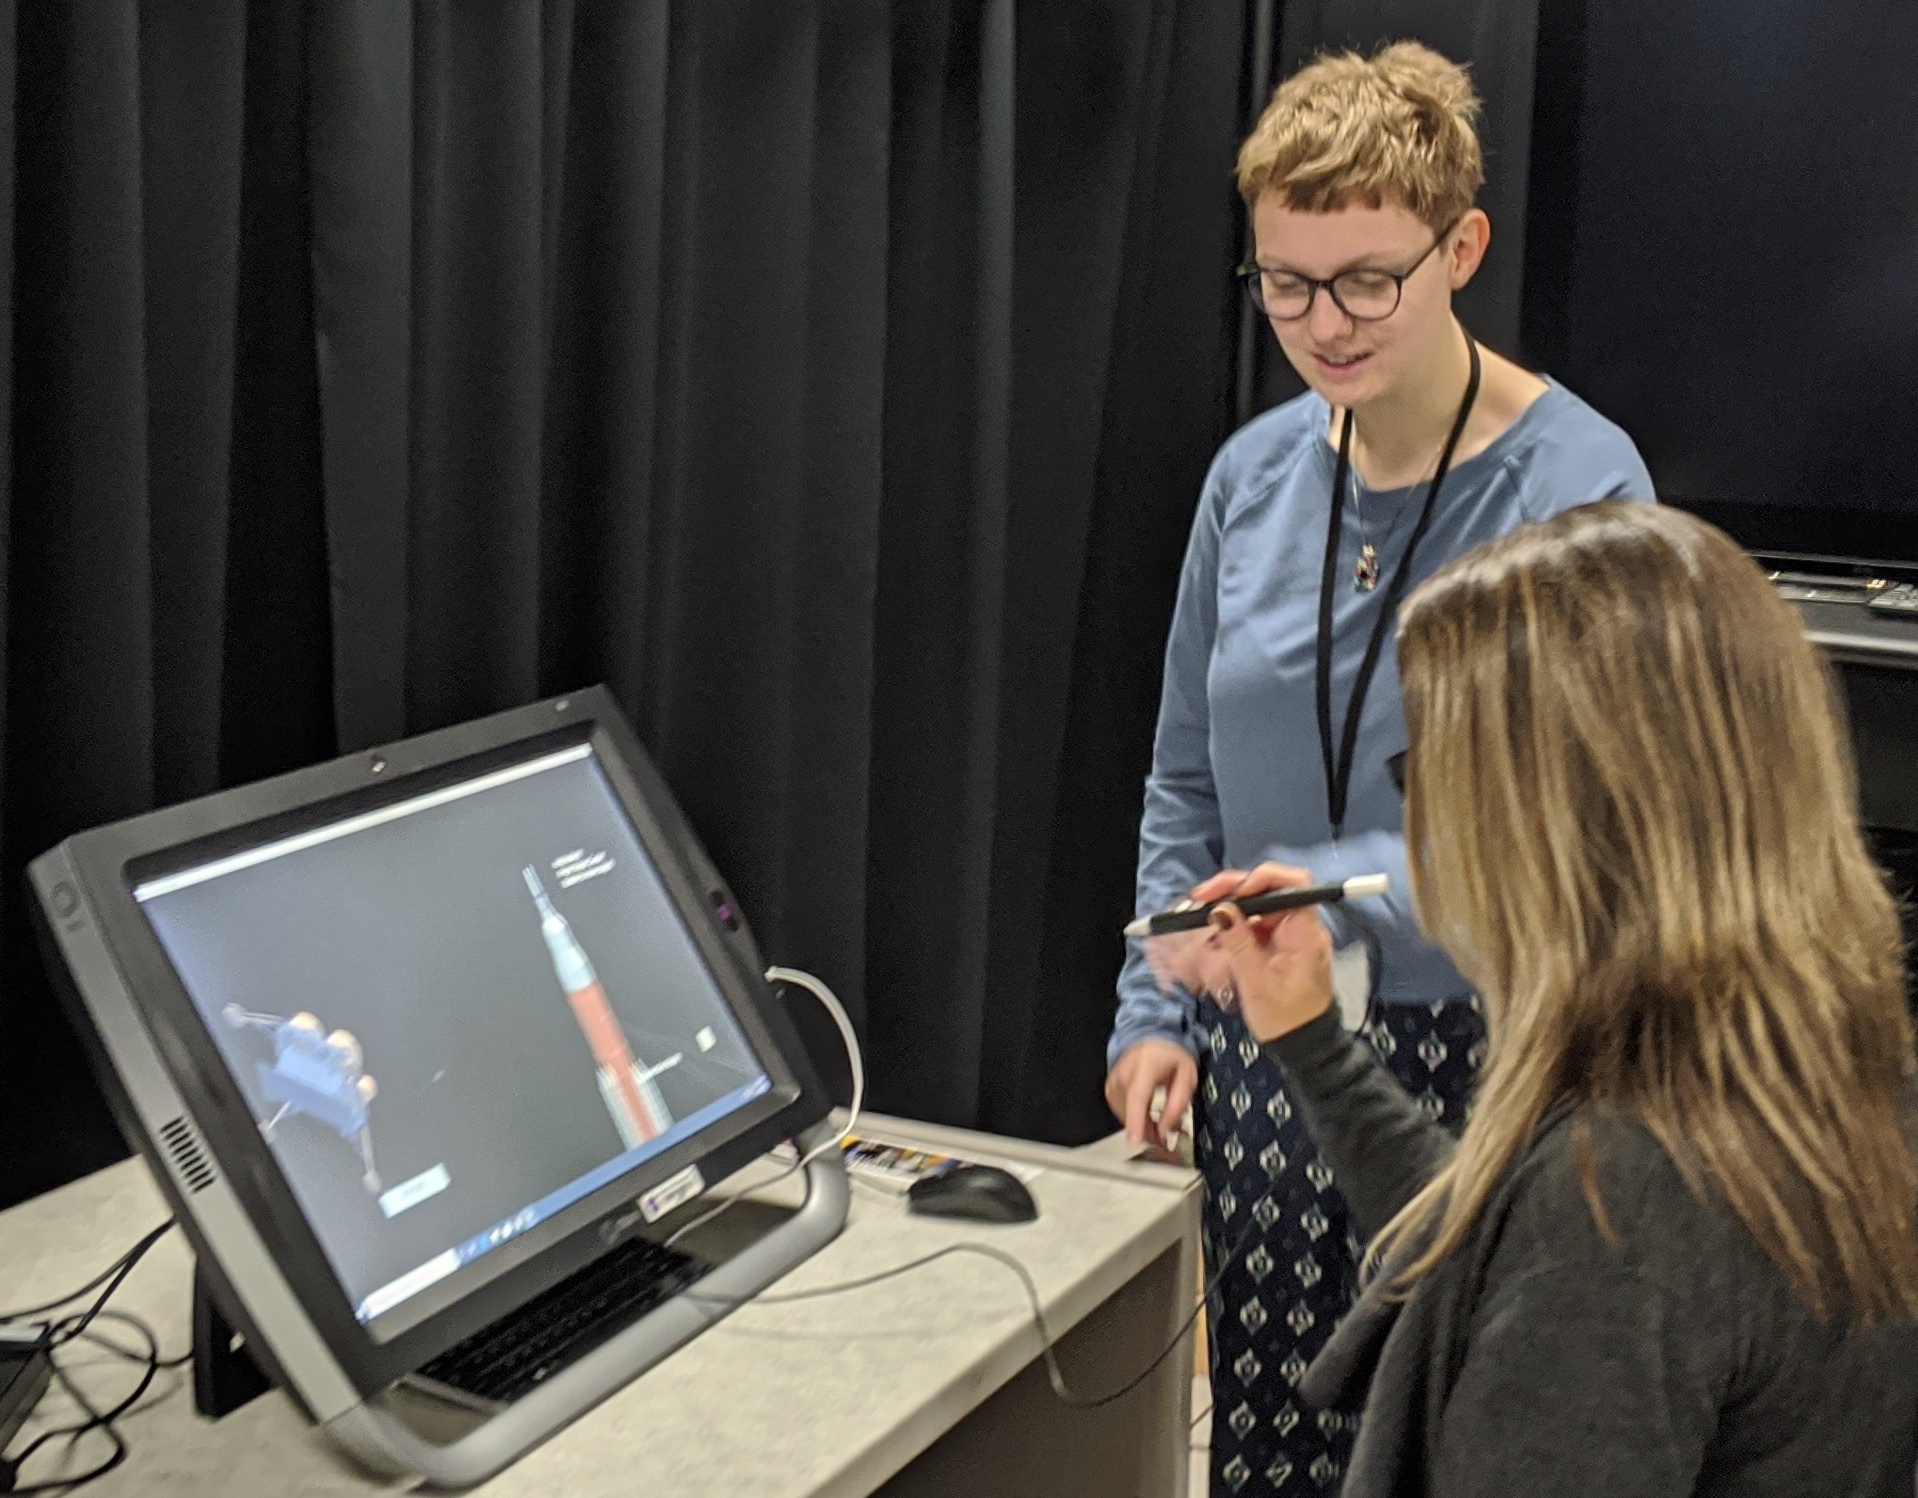
An application developed for the zSpace called “NASA Concept Vehicles” which allows users to manipulate, dissect, and learn about experimental vehicles at NASA.
The zSpace is a 3D augmented reality computer operating on Windows OS along with a stylus and glasses that extend typical three-dimensional viewing by allowing the user to pull content out of the screen. The application developed for the zSpace is called “NASA Concept Vehicles” and allows users to manipulate, dissect, and learn about experimental vehicles at NASA. The app consists of a central hub in which users can view all models together along with options to focus on only one vehicle. The parts of each vehicle are labelled (where information is available) so that when the users dissect the model, the app displays information on the specific part they are holding.
Concept Hub apps created by Myranda Uselton (Fall 2019 intern). There are aeronautics and space versions. The aeronautics version shows the Urban Air Mobility drones (for human transportation in large cities) and the X-57 motor (an all-electric experimental plane). The space version shows the Space Launch System (SLS – rocket for the Artemis missions) and the Lunar Surface Power (conceptual power/charging station for lunar rovers in the Artemis mission).
The zSpace is unique in that, unlike other 3D computer monitors, it allows users to manipulate 3D objects and bring those objects seemingly off the screen (the company terms this “breaking the screen barrier”). In effect, the zSpace provides a portal from which users can pull into their own reality. While the zSpace markets itself singularly toward education, it also could greatly benefit research fields such as engineering. The developer team at GVIS hopes to expand “NASA Concept Vehicles” in the future by adding the option for users to import their own 3D models for viewing. This function would expand the app’s audience to engineers at NASA who would like to edit or test their model in stereoscopic 3D. This would entail adding a preprocessor to the existing application so that user-imported models would take on the correct formatting and scale.
Proposal: Remote Collaboration Using AR and VR
The goal of this project was to create a proof-of-concept system that provides a more collaborative environment between researchers in a lab and remote researchers while an experiment is underway
In 2016, the GVIS Team proposed creating a system that provides a remote lab researcher with an immersive, collaborative experience using medium to low cost computer-based devices. This would increase the frequency of collaborative lab-based research, reach a greater audience of researchers including those with disabilities, and reduce travel costs for NASA for inter-Center collaborations and with outside customers.
The current mode of testing requires the operational and research staff to be physically present at the facility during the test. Given increased testing from external entities and NASA’s “Work From Anywhere (WFA)” program, the need to provide a level of remote testing interaction is highly warranted. If such a vehicle existed, customers and researchers could interact and/or view the realtime testing results without the requirement of physically being at the testing facility. This will ultimately save money while enabling more inclusive participation during valuable testing operations.
This proposal created a proof-of-concept system that provides the remote researcher with an immersive “testing” experience using medium to low cost computer-based devices including virtual reality devices, cameras, and natural user interface devices.
Proposal: FARSIGHT (Facility Augmented Reality System Integrating Graphical Holographic Technology)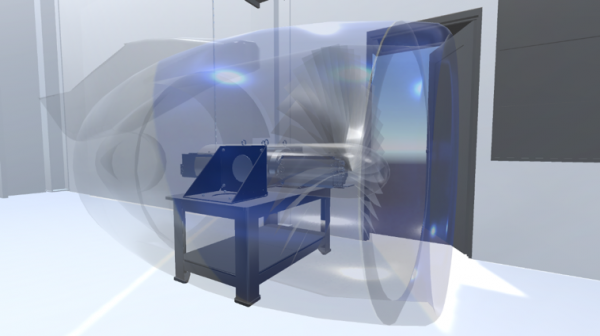
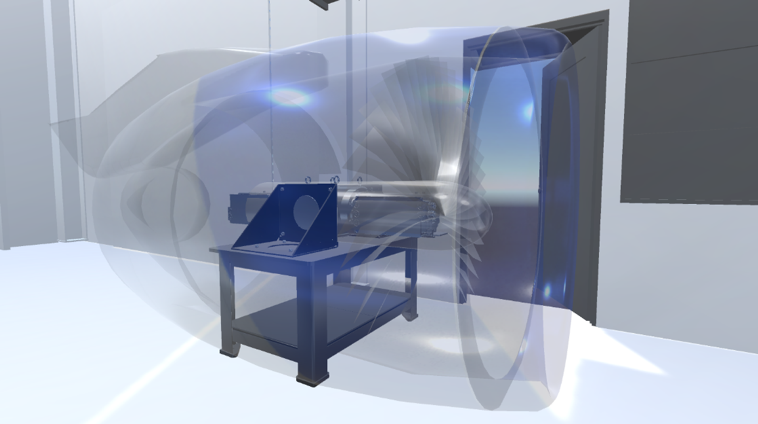
Utilizing Augmented Reality (AR) to enhance the capabilities and project efficiencies in a Facilities Testing Environment saving time and money while enhancing the testing process.
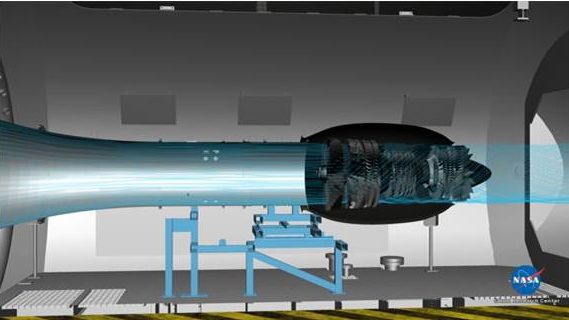
In 2017, the GVIS Team proposed exploring utilizing Augmented Reality (AR) to enhance the capabilities and project efficiencies in a Facilities Testing Environment. Using AR, the engineer will be able to insert virtual prototype components and structural models into the actual testing apparatus to: 1) simulate the integration the component into the test, and 2) enable prototype component placement, fit, and assessing engineering and maintenance access. This proposal would promote testing efficiencies by removing the requirement to physically produce engineered mock-ups to address these concerns. New designs could simply and easily be dropped into the actual testing environment and viewed from various angles against the real hardware.
Our specified test case will be Aeronautics Research Mission Directorate’s NASA Electric Aircraft Test Bed (NEAT) which intends to test electric propulsion components and designs on a test rig of appropriate size to a full-sized targeted airframe.
While wearing an AR headset the engineer can see the actual test article and superimposed virtual components. For example in the figure above a 3D representation of the fan and engine casing nacelle appear on the actual electric motor test stand. The AR components appear to occupy real space and can be viewed from any angle, allowing the engineer to actually “look under” the augmented reality components if desired. Other analytical or experimental data could also be presented, for instance a temperature overlay could be visualized on the motor casing during the test.
Proposal: Integrating CFD computational results over real-world test hardware using Augmented Reality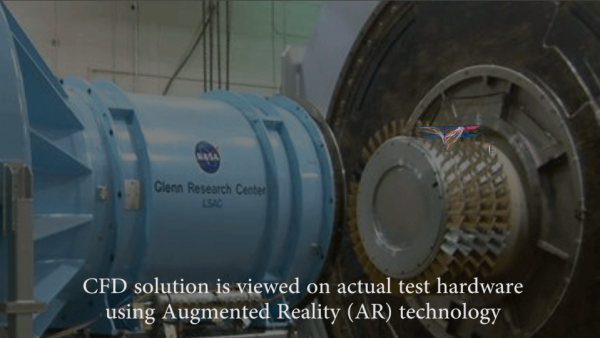
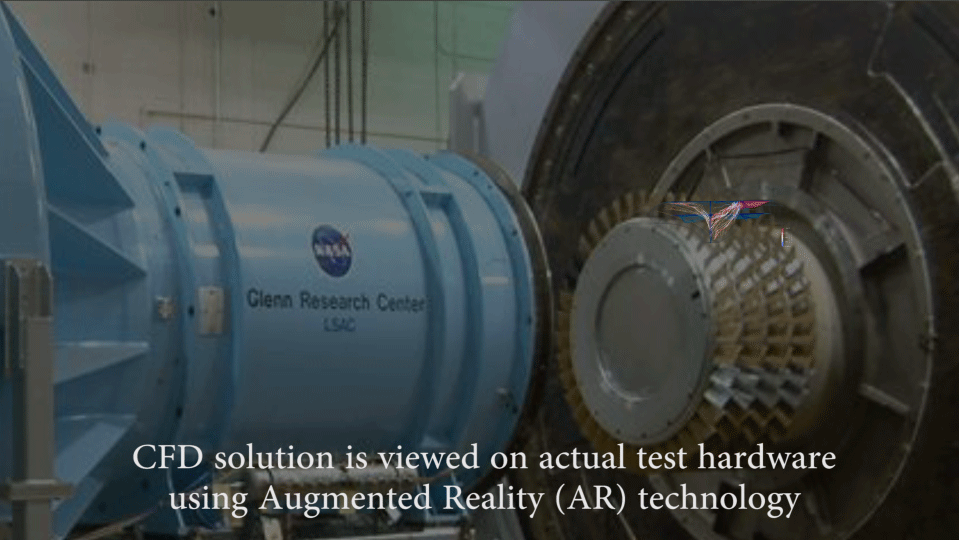
Visually integrating CFD computational results over real-world test hardware using Augmented Reality (AR)
The proposal was to investigate techniques for visually integrating CFD computational results over real-world test hardware using Augmented Reality (AR). The Team would work with Microsoft to use cutting edge streaming technology between a client and AR device targeting a future small core compressor test ARMD is conducting. The results of this effort would have enabled researchers and engineers insights to improve the complex relationships between the air flow and compressor blades (from the W1A Low Speed Axial Compressor Rig). The knowledge could be used to improve the blades design and/or inspire new solutions.
Rarely are there integrated means to utilize predictive CFD test results at an actual facility before and during a test. This innovation could assist in testing setup and prep, and on the direct and immediate comparison between CFD and actual testing data.
The top objective is to display CFD results, in appropriate scale, over corresponding testing hardware. This ability could help facilities with identification of potential challenges, transducer or test measuring device placement, and overall visual representation of outcome before and during the test before.
A secondary objective would be to utilize this capability outside of the facility test chamber, to examine, explain, and explore testing criteria via the CFD solution.
Proposal: Medical Station Evaluation using Virtual Reality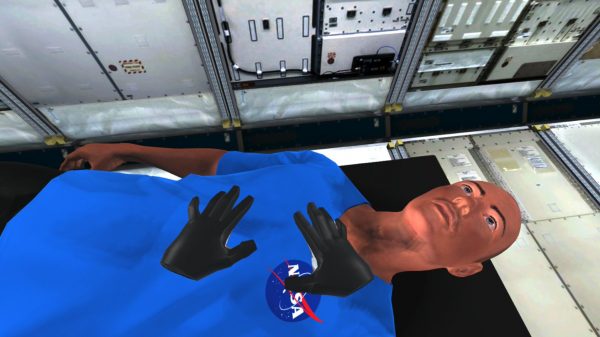

Visually integrating CFD computational results over real-world test hardware using Augmented Reality (AR)
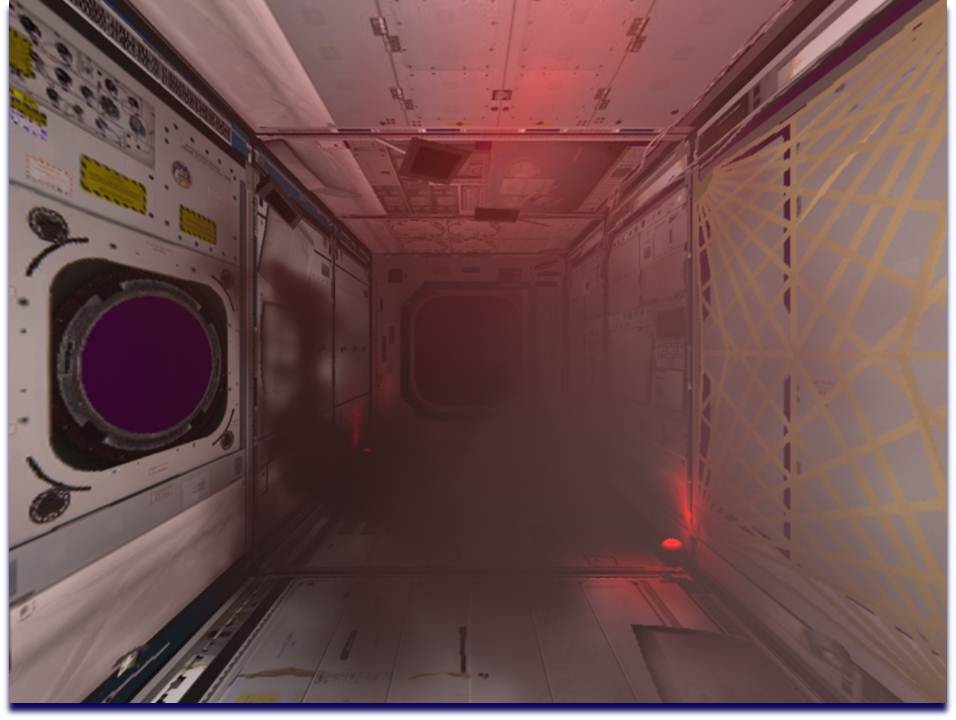
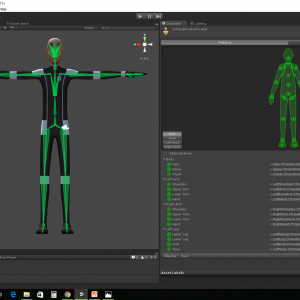
The Graphics and Visualization (GVIS) team in collaboration with the Human Research Program (HRP) would develop a virtual reality application as a pilot project and stepping stone for future capabilities. The application would replicate the conditions of the HRP’s test to evaluate a medical station for habitat design. Just as in the physical test, a caregiver would run through a series of medical procedures and their motions would be tracked using HRP’s motion capture system and later analyzed to determine operational volume in both an unrestricted and restricted environment. In this test, the caregiver will don a virtual reality headset and everything they see will be generated by the VR application.
The application developed by GVIS would visualize the habitat and patient in virtual reality, potentially using existing interior models of ISS to provide the caregiver with a sense of context and immersion. For purposes of testing operational volume, the application would provide multiple environment configurations (e.g., wide open, versus closed) which could be changed on-the-fly, allowing for a faster turnaround between tests compared to reconfiguring a full physical mockup.
The GVIS team will investigate the integration of physical models with the VR application—that is to say, having some physical elements in the test area (such as a table mockup and manikin) that are perfectly aligned with the VR visualization to provide additional feedback to the caregiver.
For the initial pilot program, GVIS will provide the computer and VR hardware needed to run the application, which will reduce initial cost and will allow GVIS and HRP to determine the VR hardware configuration that will best meet the needs of the test and the test environment.
The VR application and tests run with it will be a follow-on to the test done with a physical mockup, allowing the GVIS team to observe the test and environment to better create an application to meet the HRP’s needs. This will reduce development errors and help to spot potential pitfalls that otherwise might not be evident before running the initial VR tests, resulting in a more efficient development process and better deliverable. HRP will be able to compare results from the earlier physical tests with those from the VR test, and evaluate the potential advantages of using VR for this type of analysis.
Deliverable: The GVIS team will develop a virtual reality application that mimics the HRP’s physical test. GVIS will support the setup and usage of this application in a test, providing the computer and VR hardware. Based on testing, GVIS will make a recommendation on hardware for future VR test experiences going forward.
Image Processing for endoscope display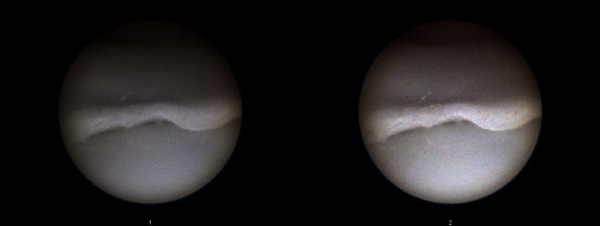
Development of image processing algorithms applied to images for a fiber endoscope product.
Under a Space Act Agreement with a biomedical company, the team developed initial algorithms to:
- analyze current endoscope image quality
- conceptually develop a method to apply image processing algorithms
- remove the fiber patterns
- lesson noise
- sharpen images
- improve color and illumination
- optimize image quality
Volcanic Ash Ingestion Visualization
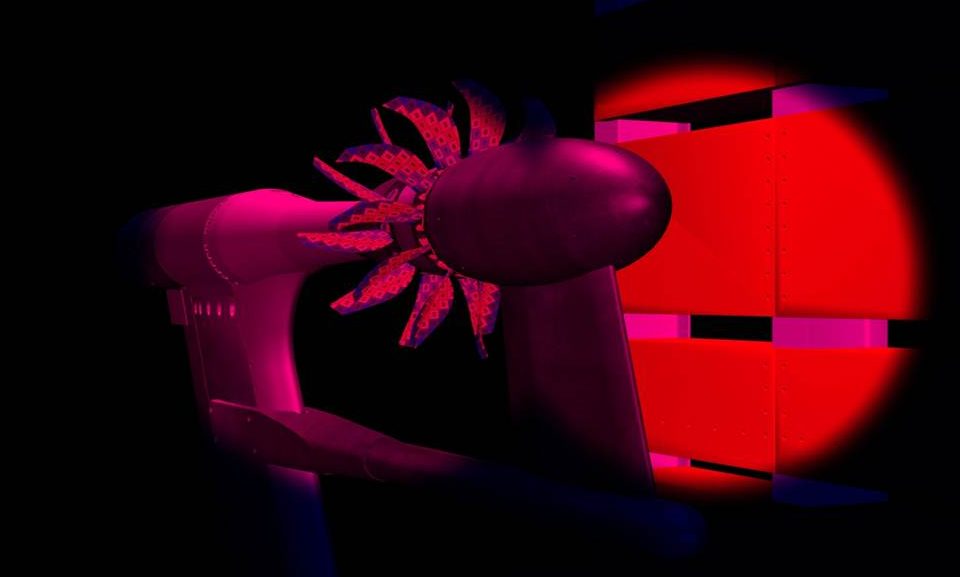
 The ingestion of volcanic ash by commercial aircraft engines is a safety issue that, until recently, hadn’t been studied in a controlled way. Volcanic ash forms glass in the hot sections of engine—reducing flow and clogging cooling holes—as well as erodes compressor blades and other parts of the engine. The NASA Vehicle Integrated Propulsion Research (VIPR) tests studied these effects by sending volcanic ash through an airplane engine under controlled conditions.
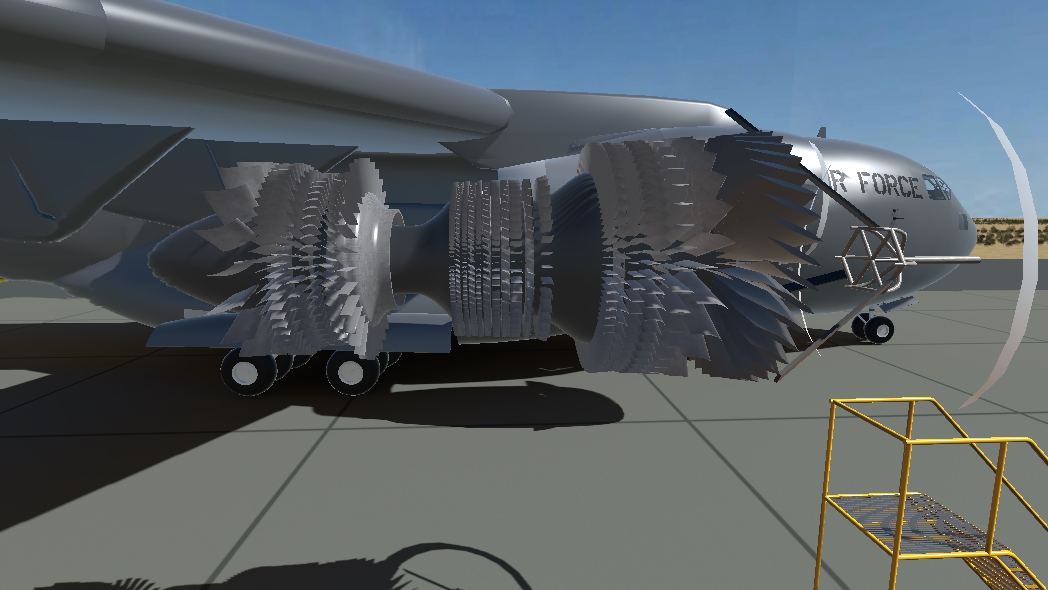
The GVIS Lab created a stereoscopic 3D visualization of the test, in order to demonstrate the equipment used during testing and to explain the risks posed by volcanic ash ingestion. The user is placed on a tarmac next to an Air Force C-17 cargo plane where a rig similar to the one used in the VIPR test is positioned to blow ash into one of the aircraft engines. With the engine running and the ash being ingested, the user is presented with a cross-section of the engine, where they can see the location of probes used in the actual test. Zooming in on the rotor stages show the compressor blades being eroded by the ash. Likewise, zooming into the section just aft of the combustion area shows the accumulation of ash “glass”. This visualization provided a valuable way to explain both the effects of volcanic ash ingestion on engines as well as the work being done by NASA to study it.
Fluid Physics Augmented Reality Projection
GVIS Lab’s Fluid Physics Augmented Reality Projection is a program designed to help visualize water pressure.
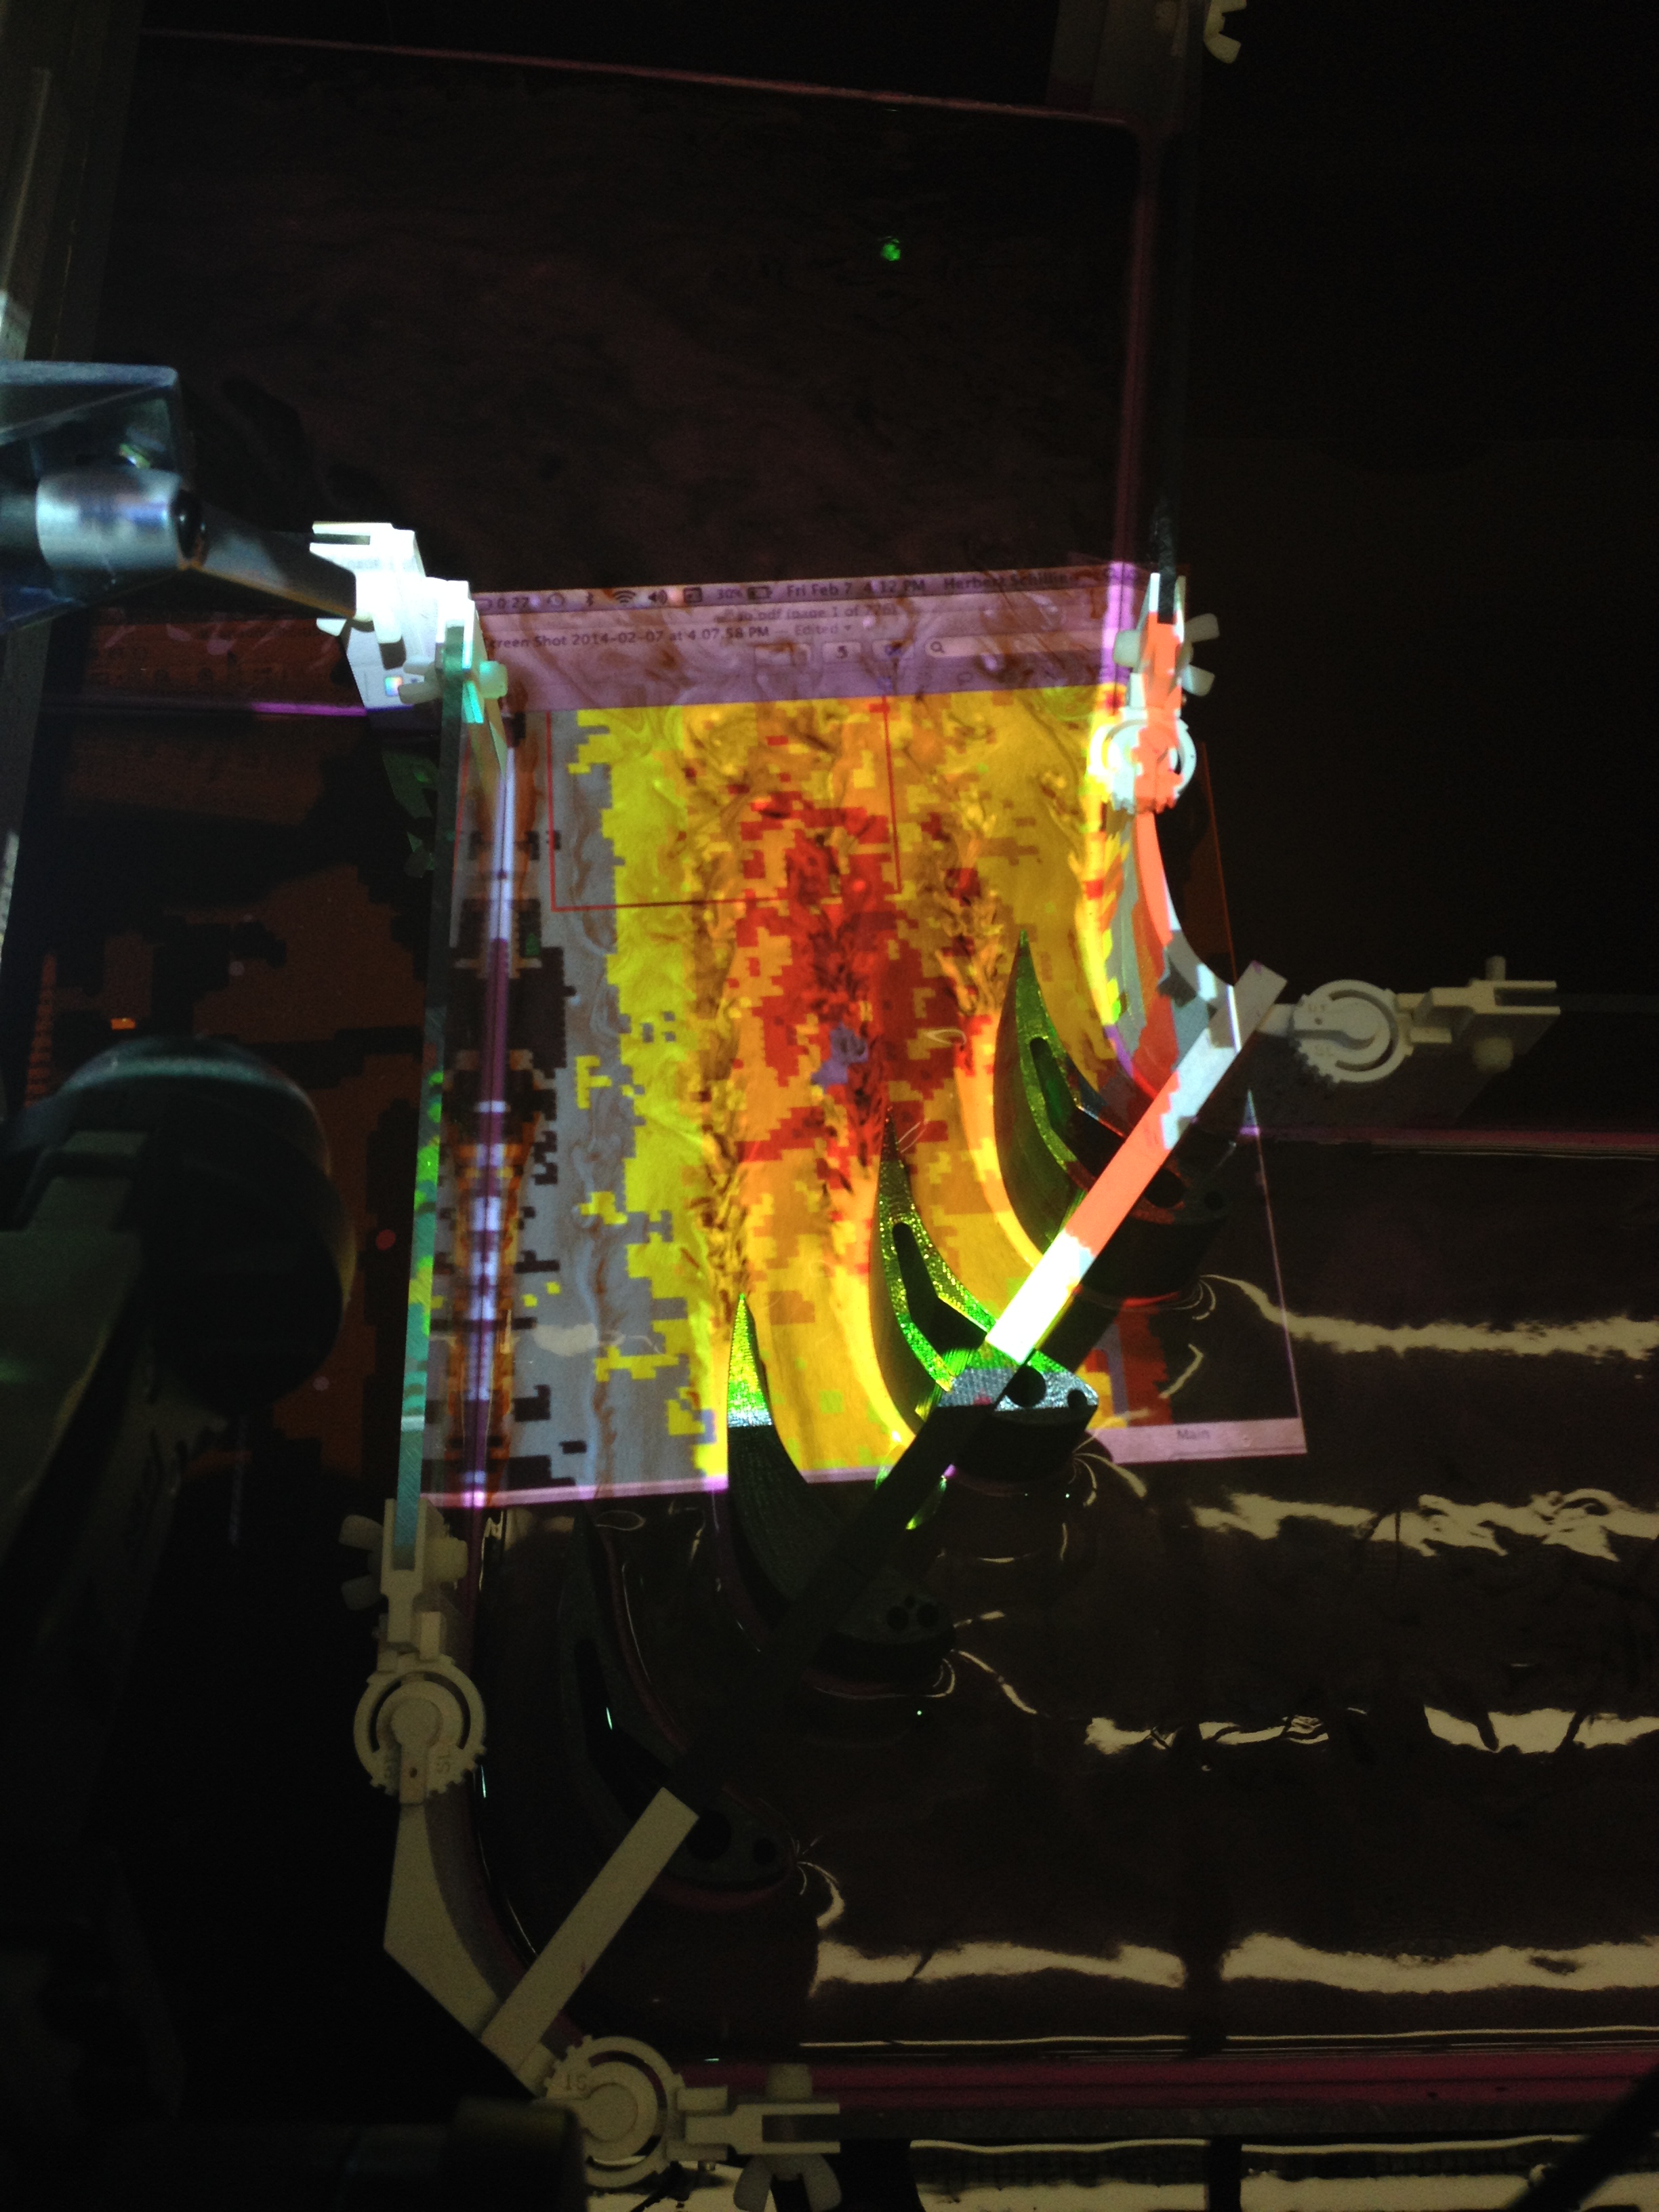
The Turbomachinery and Turboelectric Systems (TTS) branch at NASA’s Glenn Research Center uses a water tank to test certain projects. The test article is submerged within the tank and then dye is added to collect water flow data. The entire system works similarly to any of Glenn’s wind tunnels except with water instead of air. Although the dye is useful for observing the movement of the water, it can not determine its height. If the height of water in any area of the tank is known, the pressure of that area can also be calculated. In turn, knowing the water pressure can provide valuable insights from any given test article.
To help the TTS branch, the GVIS Lab designed a program for the Xbox Kinect that could determine the topography of the water and then project and color-code that data back onto the water in real time. This gave TTS a visual representation of the water pressures in the environment of their test article.
GEER Test Cell Visualization
The Glenn Extreme Environments Rig simulation is an interactive visualization of Glenn’s extreme environment test chamber.
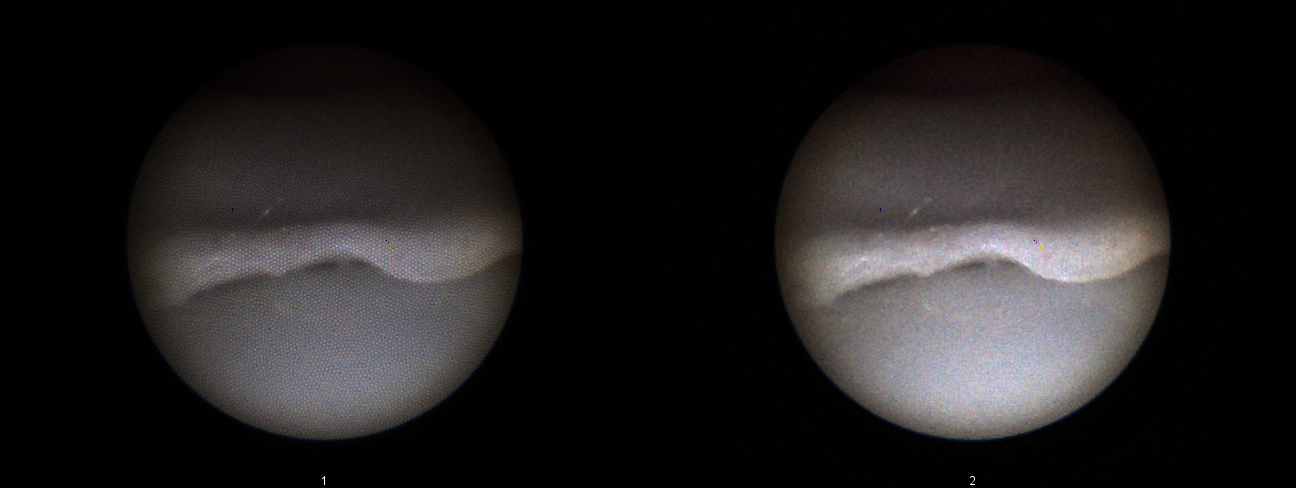
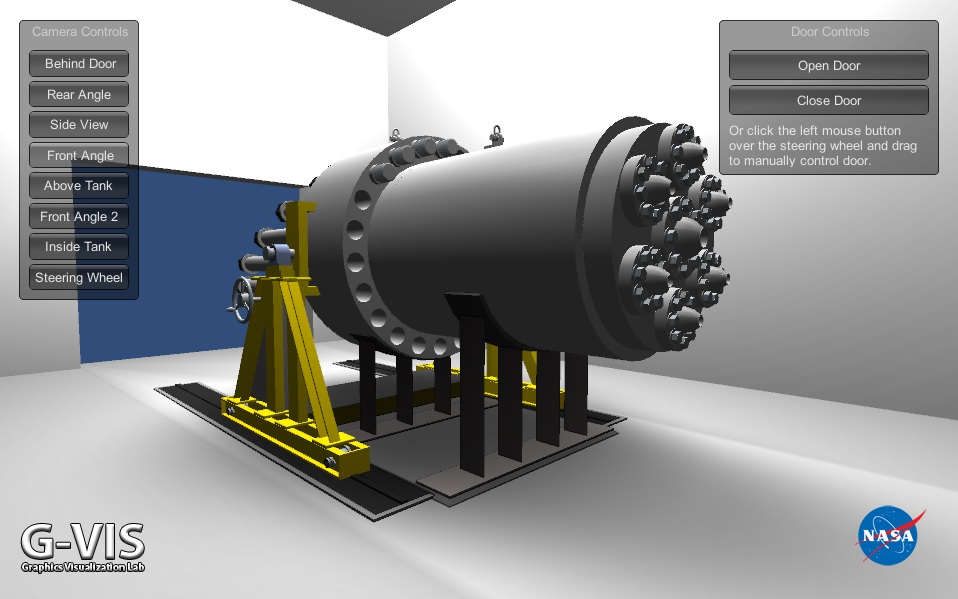
The Glenn Extreme Environments Rig (GEER) is an extreme environment test chamber that creates the high-temperature, high-pressure, toxic atmospheric conditions found in extreme environments such as the planet of Venus. The largest test chamber of its kind in the country, it can simulate temperatures of up to 1,000 degrees Fahrenheit and atmospheric pressures 100 times that of Earth.
GVIS Lab created a virtual reality simulation of the test chamber for illustrative and demonstration purposes. The initial release of this virtual test chamber visualizes the chamber itself, allowing the user to explore it from various pre-set camera positions and to operate the large chamber door. GVIS Lab has also added support for the Oculus Rift so that users can experience the test chamber in 3D. The visualization also operates well with touch screens such as the Perceptive Pixel.
Pressure Sensitive Paint Visualization
GVIS Lab’s Pressure Sensitive Paint visualization for the Aeronautics Test Program simulates a test run in the Glenn’s 9×15 acoustic wind tunnel where pressure sensitive paint was used to measure air pressure on a test article.
This simulation mimics the pressure sensitive paint (PSP) testing that was performed during an Open Rotor Engine test. It guides the user through various stages of the testing process, which includes the demonstration of the technology, the marketing of the technology, and the gathering of data. The main display utilizes passive 3D technology and audio to provide an immersive experience for the participant. User interaction is controlled by a secondary touch-screen display in front of the main 3D screen.
The user begins the simulation by initiating a wind tunnel test. Air then flows through the tunnel and the engine test article starts. To prepare for data acquisition, the user then sets up an ultra-violet light and then tunes the frequency of the strobe to illuminate one specific test article blade. Simulated data from the test follows shortly.
Propulsion Systems Lab Visualization
Aeronautic Test Program’s Propulsion Systems Lab Visualization is a custom, interactive 3D experience simulating the new altitude engine icing capabilities of the Propulsion Systems Lab at NASA Glenn.
The simulation is geared toward marketing the facility’s new capabilities and providing a lightweight and immersive educational tour of facility operations. It steps the user though a virtual test run of an engine icing experiment. Spray-bars that are installed within the real-world tunnel work in tandem with the airflow to simulate conditions in Earth’s atmosphere that would cause ice to form within the interior of an aircraft engine. The simulation goes into detail on how this ice formation can impact the inner workings of the engine by displaying an animated 3D cross-section of the phenomenon in progress.
This visualization allows future facility simulations to benefit from the design and code developed for this project. Additionally, it helps foster discussions about engine icing within a Glenn context.
Space Fire Prevention Visualization
GVIS Lab’s developed realistic 3D visualizations to investigate spacecraft fire conditions that will enhance safety on crewed spacecraft missions.
Computational Fluid Dynamics (CFD) smoke flow solutions were calculated using the Fire Dynamics Simulator (FDS) for input into our customized visualization software.
System Modeling Language Visualization
GVIS Lab supports the work of Glenn’s Power Architecture and Analysis Branch.
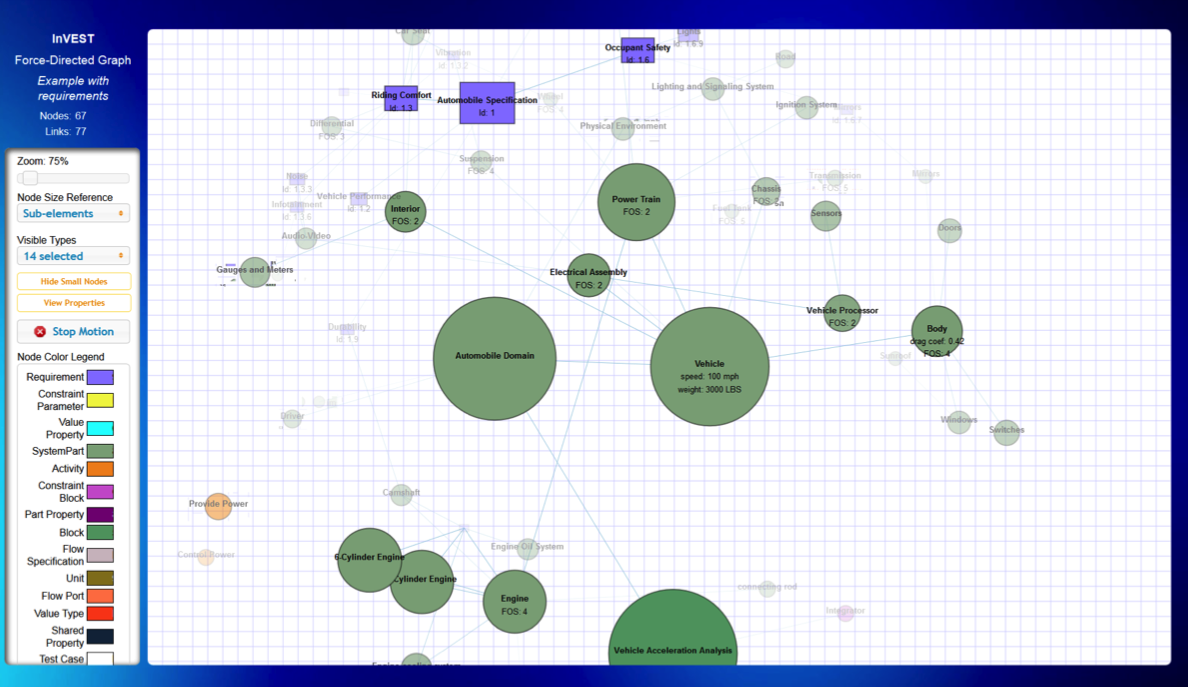
The Interactive Visualization Engine for SYSML Tools (INVEST) was a demonstration of how project models could be made more accessible to project managers and other non-systems engineers. Systems engineers use a common SYSML modeling tool that is powerful but has a steep learning curve, making it difficult to quickly communicate status to project members unfamiliar with it. To mitigate this problem, GVIS Lab developed several D3-based visualizations that could be accessed through a web browser. Snapshots were taken of portions of a model by using the reporting tool to generate JSON files, and then used D3 to visualize the data as interactive web pages called “dashboards”, depicting a force-directed graph, dependency wheel, relationship matrix, and others. Users could zoom the displays in or out, choose which data was visible, and highlight areas, with simplified controls that were much easier to use than the original systems engineering application.
Virtual Fuel Cell Interactive Simulation
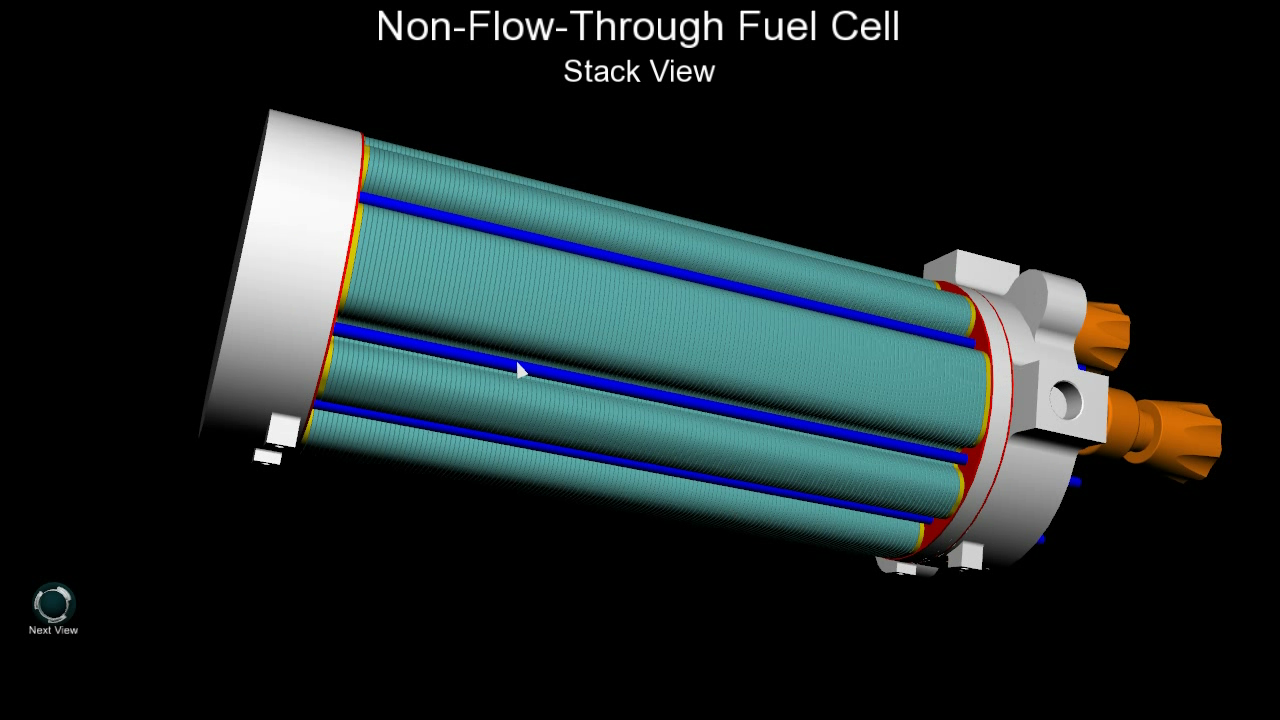
The Virtual Fuel Cell Interactive Simulation used a physics-based gaming engine to visualize the chemical reactions that occur in a fuel cell.
The Space Power Facility (SPF) at NASA’s Plum Brook Station requested that a visualization be made of the inner workings of a fuel cell. The main purpose of this simulation is to educate the public on how the chemical and electrical processes of fuel cells work together to produce power. Additionally, the simulation demonstrates the issues that arise when chemical impurities are introduced into the system and proposes a design solution to overcome such a challenge. This project is currently displayed at the Great Lakes Science Center in Cleveland, Ohio.
Virtual Stirling Engine Model
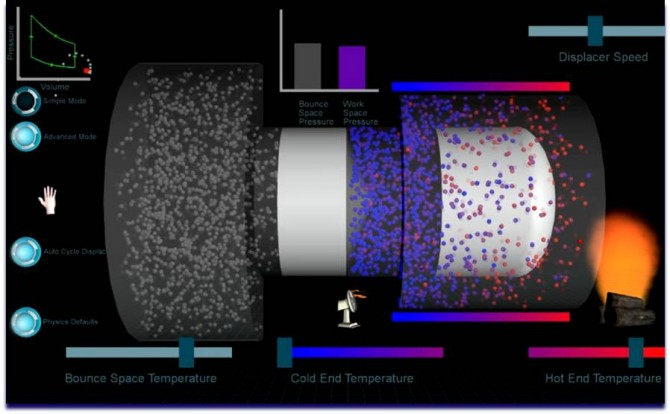
A realistic and interactive 3D Stirling Engine was modeled for customer outreach and educational purposes.
The virtually modeled engine is fully functional and depicts the inter-workings of the system, including gas compression and flows, thermal heat transfers, power generation, and general system power-generating functionality.
Visualizations for Cleveland Clinic Neuroscience Research Project
GVIS Lab supported the Cleveland Clinic with a study involving autistic patients.
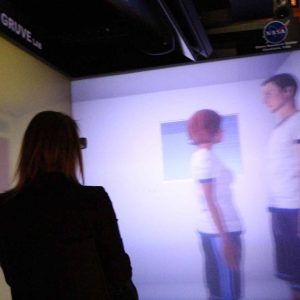
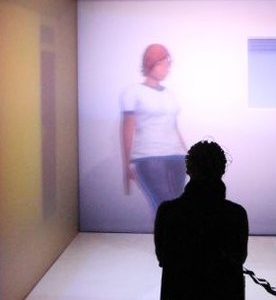
The GVIS team and the Cleveland Clinic, under a Space Act Agreement, formed a partnership to study the use of immersive 3D environments for activating mirror neuron networks in the brain through motor imagery training. The study focused on improving social interactions in persons with autistic spectrum disorders. The study took place in the GRUVE Lab.
GVIS Lab, using a motion capture system at the Center’s Exercise Countermeasures Lab, created visualizations of people doing simple activities which were then displayed in the GRUVE Lab while a patient wore an EEG headset.
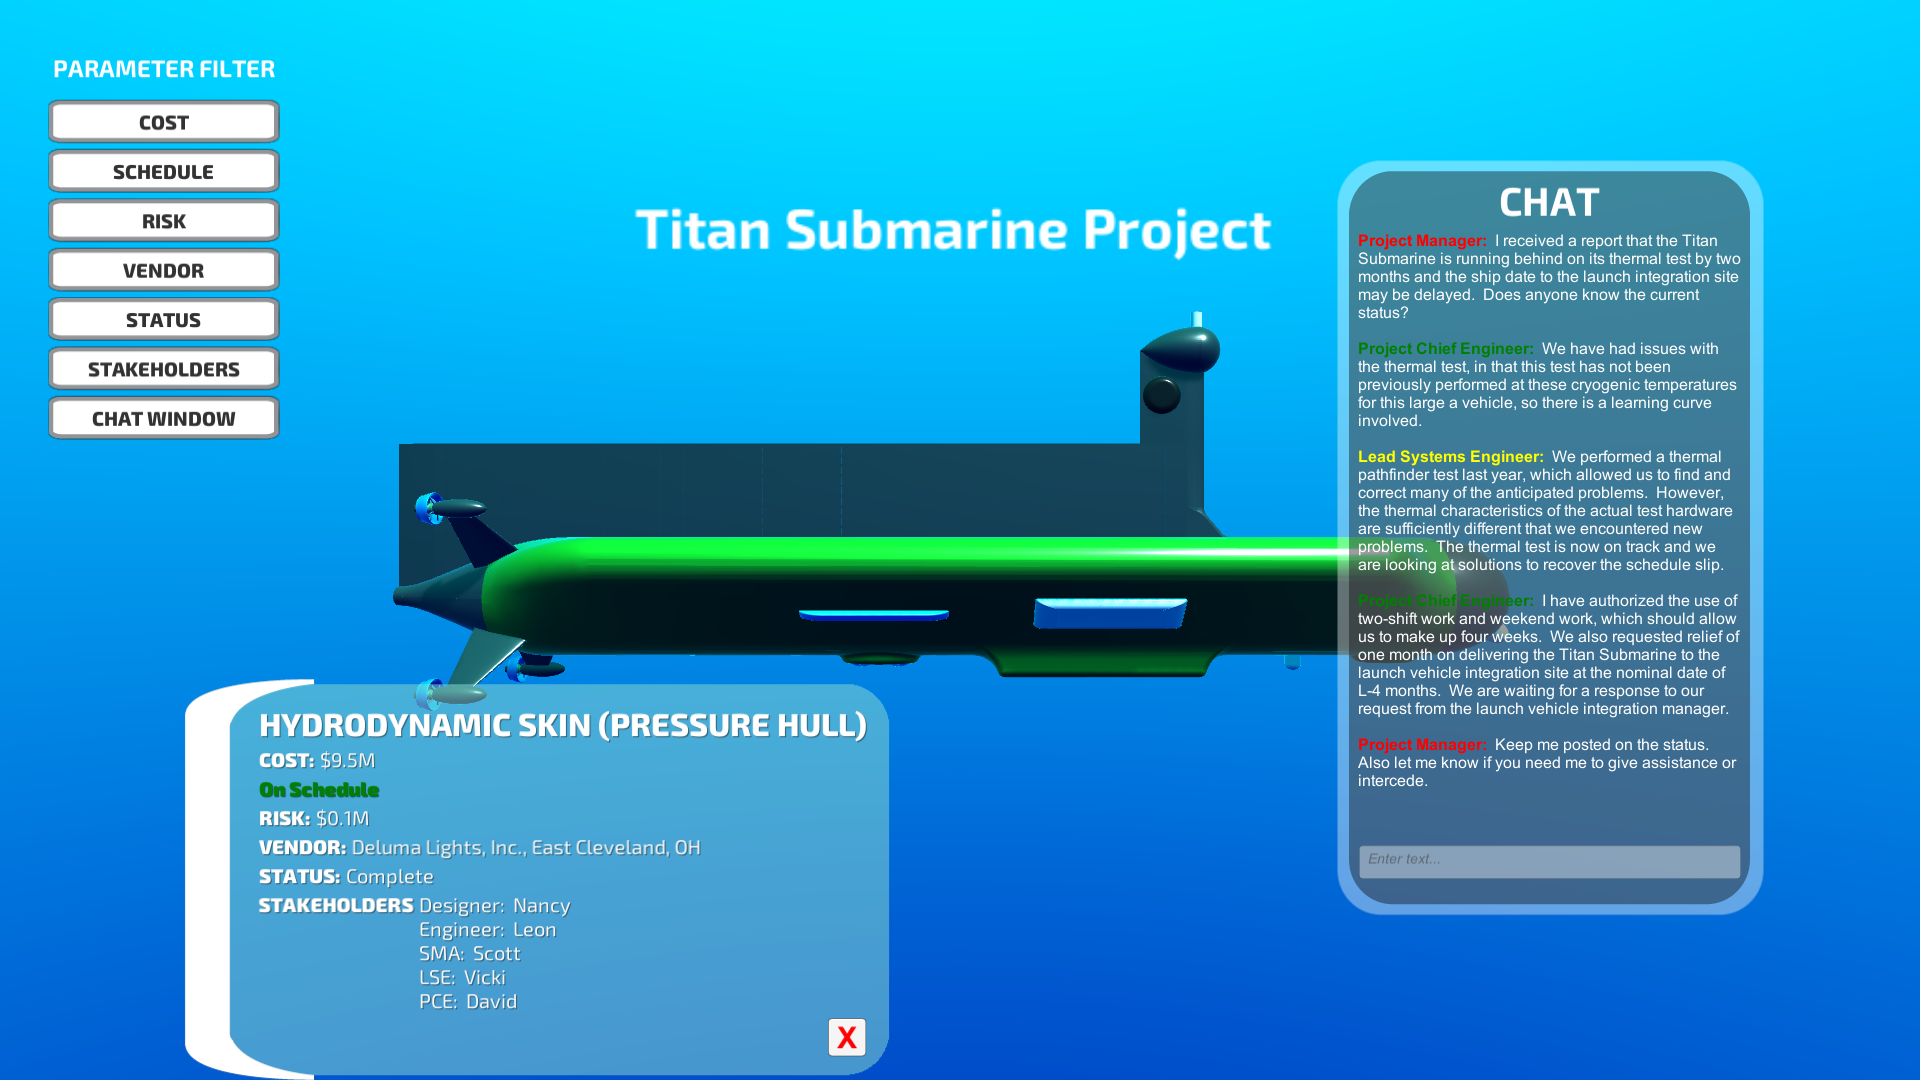
Augmented Images of Remarkable and Integrated Engineering (AIRIE)
The Augmented Images of Remarkable and Integrated Engineering (AIRIE) application was a prototype application that displays images of a system-of-interest with information superimposed on top of or near the system’s parts. Program and project managers, engineers, safety and mission assurance personnel, and other stakeholders have access to information that is of high interest, up-to-date, and in an easy-to-see and interactive format. The extensive development and anticipated use of Model-Based Systems Engineering (MBSE) within NASA would allow automated linkages of information from the System Model to the images. Ultimately, the intention is to work towards a vision for Model-Based Project Management (MBPM). The inspiration sources for AIRIE are heads-up cockpit displays, augmented reality, and traffic and weather overlays on maps or satellite images.