Effects of Inclination on Lift Interactive
Angle of Attack
As an aircraft moves through the air, the wing is inclined to the flight direction at some angle. The angle between the chord line of the airfoil and the flight direction is called the angle of attack. Angle of attack has a large effect on the lift generated by a wing. During takes off, the pilot applies as much thrust as possible to make the airplane roll along launch rail. But just before lifting off, the pilot “rotates” the aircraft. The nose of the airplane rises, increasing the angle of attack and producing the increased lift needed for takeoff.
Boundary Layer of an Airfoil
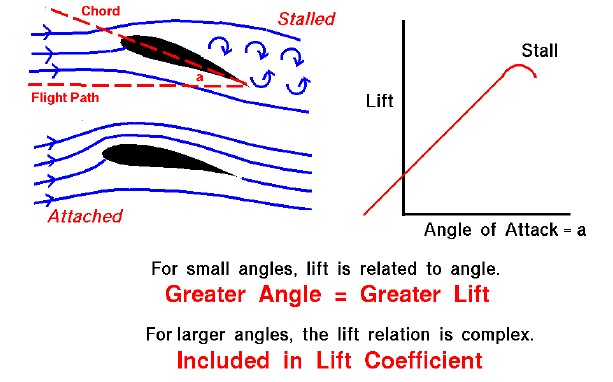
The magnitude of the lift generated by the wing depends on the shape of the wing and how it moves through the air. For airfoils, the lift varies almost linearly for small angles of attack (within +/- 10 degrees). For higher inclinations, however, the dependence is quite complex. As an object moves through the air, air molecules stick to the surface. This creates a layer of air near the surface called a boundary layer that, in effect, changes the shape of the object. The flow turning reacts to the edge of the boundary layer, just as it would to the physical surface of an object. To make things more confusing, the boundary layer may lift off or “separate” from the body and create an effective shape much different from the physical shape. The separation of the boundary layer explains why aircraft wings will abruptly lose lift at high inclination to the flow. This condition was called a stall when it was first encountered by the Wright brothers, and that term still remains to this day.
Stall Point
On the slide shown above, the flow conditions for two airfoils are shown on the left. The shape of the two foils is the same. The lower foil is inclined at ten degrees to the incoming flow, while the upper foil is inclined at twenty degrees. On the upper foil, the boundary layer has separated and the wing is stalled. Predicting the stall point (the angle at which the wing stalls) is very difficult mathematically. Engineers usually rely on wind tunnel tests to determine the stall point. But this must be done very carefully, matching all the important physical parameters of the flow field.
Lift
The plot at the right of the figure shows how the lift varies with angle of attack for a typical airfoil. At low angles, the lift is nearly linear. Notice on this plot that at zero angle a small amount of lift is generated because of the airfoil shape. If the airfoil had been symmetric, the lift would be zero at zero angle of attack. At the right of the curve, the lift changes rather abruptly and the curve stops. In reality, you can set the airfoil at any angle you want. However, once the wing stalls, the flow becomes highly unsteady, and the value of the lift can change rapidly with time. Because it is so hard to measure such flow conditions, engineers usually leave the plot blank beyond wing stall. You can generate your own plots of the lift versus angle of attack using a computer simulation of the Wright’s 1901 wind tunnel.
Lift Coefficient
Since the amount of lift generated at zero angle and the location of the stall point must usually be determined experimentally, aerodynamicists include the effects of inclination in the lift coefficient. For some simple examples, the lift coefficient can be determined mathematically for small angles. (For thin airfoils at subsonic speed, the lift coefficient is 2 x pi x angle, where pi is 3.1415926…, and the angle is given in radians {pi radians = 180 degrees}.) But in most cases, aerodynamicists rely on wind tunnel testing and very sophisticated computer analysis to determine the lift coefficient.
You can investigate the dependence of lift on angle of attack using this JavaScript simulator.
Instructions
You can change the value of the angle of attack by using the slider below the airfoil graphic, or by backspacing, typing in your value, and hitting “Return” inside the input box next to the slider. By using the drop menu labeled “Select Lift” you can choose to display either the lift or lift coefficient on the graph. You can perform the calculations in either English or metric units by using the drop menu labeled “Select Units”. The red dot on the graph shows the current set of conditions.
As an experiment, set the angle to 5.0 degrees and note the amount of lift. Now increase the angle to 10 degrees. Did the lift increase or decrease? Increase the angle again to 15 degrees. What do you notice in the view window? Set the angle to 0 degrees. Is there any lift? What does this tell you about the shape of the airfoil? Find the angle for which there is no lift.
Please note: the simulation below is best viewed on a desktop computer. It may take a few minutes for the simulation to load.
The original source code for the simulations is available for users to download at the BGA Simulations on GitHub.