Computed Performance Predictions
Engineers make mathematical predictions of the performance of any new aircraft as part of the design process. These predictions use the best data and mathematical techniques which are available to the engineer. As the Wright brothers were designing their first aircraft, the basic principles of aerodynamics were being discovered. The brothers made mathematical predictions of the performance of their aircraft. And when their actual performance did not agree with their prediction on the 1901 aircraft, they built their own wind tunnel to refine their predictions and to discover the solution to other performance problems.
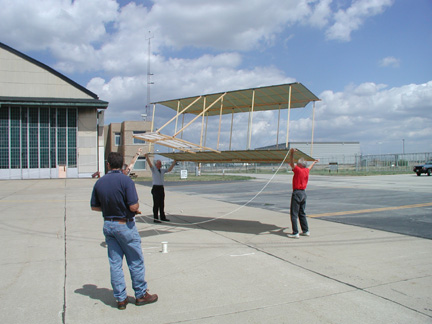
For our full scale replica of the Wright 1900 aircraft, we have also made mathematical predictions of the aircraft performance. NASA engineers in the twenty first century have many new tools available to make these predictions; tools which were not available to the Wright brothers. The newest tool is the use of computers to predict aircraft performance. Computers can solve equations which model the flow of air around an object. The models can be made very simple by neglecting certain effects, or they can include all the complexity of flowing gases. Simple models run fast on small computers and complex models take a long time on a big computer. Simple models give first approximations to the final answer and complex models can give very accurate answers.
You can interactively predict the performance of our replica by using a specialized version of our simple FoilSim program. This program computes an ideal flow around a single airfoil. A more accurate prediction of performance has been computed by Eric McFarland of NASA’s Glenn Research Center. His program computes the interaction of the top and bottom wings, the canard, and the ground. Here is a sample of his computed results:
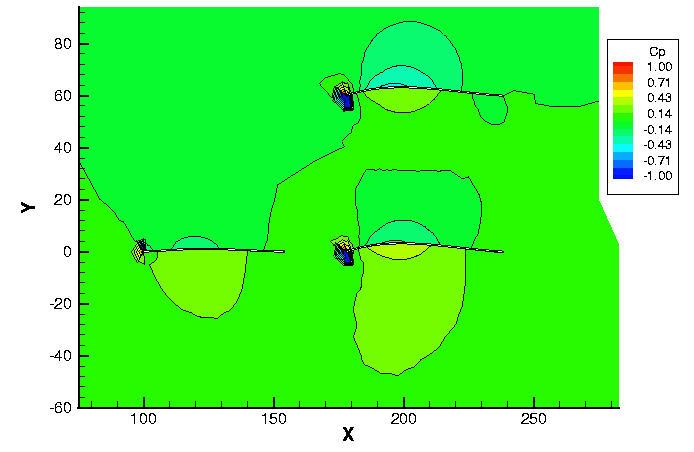
This computation was performed for a wind velocity of fifteen miles per hour, and the aircraft flying five feet above the ground. The computed pressure is color coded and you can determine the value of the pressure by comparing to the color bar. With this computation, we see that most of the pressure changes take place near the leading edge of the airfoil. The pressure on the upper surface of each wing is lower than the pressure on the bottom surface. Notice that the pressure on the top wing is slightly different than the pressure on the bottom wing because the flow around each wing interacts with the other.