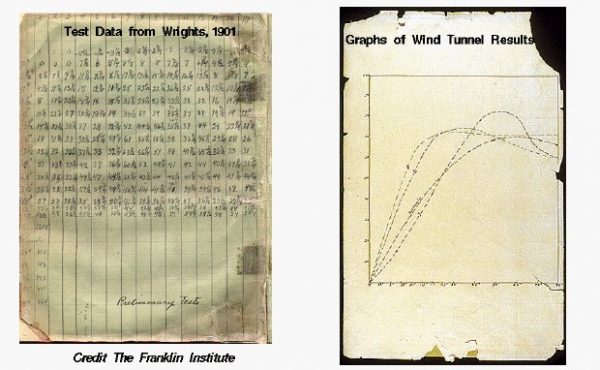
Wind Tunnel Results
During the fall of 1901, the brothers began to question the aerodynamic data on which they had based the design of their 1900 and 1901 gliders. They decided to measure their own values of lift and drag with a series of wind tunnel tests. To measure the lift and drag, the brothers built small models of their wing designs and placed them on a measuring device called a balance. There were two balances, one for lift and the other for drag. They would test each model on both balances to determine the effect of design variables on lift and drag. Most of the models were designed to perform a parametric study by changing the value of only one design variable between models. Then by comparing the performance of the two models they could determine the effect of the single changed variable on lift and drag.
To obtain data, one of the brothers would look through the view window on the top of the wind tunnel and record the angles on the balance output dial in the test section. On the left side of the figure, we see the actual data as recorded by the Wright brothers into their data book. These photos are provided by the Franklin Institute where the actual data books are kept. After recording the raw data, the brothers had to do some additional math to produce usable lift and drag coefficients from the output dial measurements. Engineers call this step data reduction. Finally, the reduced data was plotted on graph paper, as shown at the right of the figure. This allows a quick comparison between the results of several tests. Engineers still use graphs to present data. You can duplicate the wind tunnel tests of the Wright brothers by using our interactive wind tunnel simulation. There are 30 different models from which to choose and you can test each model on both balances and record and reduce your data the same way that the brothers did it in 1901.
At the end of their 1901 wind tunnel tests, the Wright brothers had the most detailed data in the world for the design of aircraft wings. What did the data tell them?
In the following discussions, the word performance indicates a combination of the effects of lift and drag, normally expressed as the drag to lift ratio. A low value is better than a high value of this parameter.
- Curved surfaces produce more lift than flat surface. The greater the curvature the greater the lift. (This information was available in the Lilienthal data).
- Curved surfaces also produce more drag than flat surface. The greater the curvature the greater the drag. So the most desirable cross-section is a curved surface with a small camber. The brothers settled on a 1/20 camber for their designs.
- Amongst curved surfaces, parabolic curves (those with the highest camber nearer to the leading edge) have better performance than circular arcs (where the highest camber lies in the middle of the foil).
- Long thin wings (high aspect ratio) have better performance than short wide wings (low aspect ratio). This helped to explain the problems of the 1901 glider and directly affected the design of the 1902 glider. The 1902 had roughly the same wing area, but twice the aspect ratio of the 1901.
- For many of the wings tested, the highest lift does not occur at the greatest angle of attack; the lift peaks at a low angle of attack and then decreases. The brothers were surprised by this result and did additional tests with a weather vane balance to verify it. A modern aerodynamicist would recognize this pattern as indication of a wing stall which occurs at high angles of attack due to boundary layer separation.
- Curved wing tips produce lower drag than rectangular wing tips. The detailed shape of the wing tip has a large effect on wing performance. The next time you visit an airport, or go to an air show, notice the many different shapes of the wing tips on various aircraft. Designers still try to optimize the performance of their aircraft.
- There is a slight performance penalty associated with bi- and tri- wing configurations; putting one wing on top of the other does not give you exactly twice the performance of the single wing alone. The brothers attributed this difference to the increased number of wing tips. While there is a performance penalty, the structure can be made very strong and light with a bi-wing design. Modern aircraft typically have a single wing made of light, strong aluminum. But this material wasn’t available in large quantities for the Wright brothers.
- The brothers tested Otto Lilienthal’s wing geometry (Model #31) in their wind tunnel and compared the results with Lilienthal’s published data. Wilbur wrote to Octave Chanute that there were no errors in Lilienthal’s data within the accuracy of his test techniques. But Wilbur noted the importance of total wing geometry (airfoil shape and wing planform) on wing performance. In 1900 and 1901, the brothers had closely approximated Lilienthal’s airfoil shape, but had a very different wing planform which generated very different wing performance from Lilienthal’s published data.

