Internal Combustion Engine – Otto Cycle
The Wright brothers used a gasoline powered, four-stroke, internal combustion engine to power their aircraft. In an internal combustion engine, fuel and air are ignited inside a cylinder. The hot exhaust gas pushes a piston in the cylinder which is connected to a crankshaft to produce power. The burning of fuel is not a continuous process but occurs very quickly at regular time intervals. Between ignitions, the engine parts move in a repeated sequence called a cycle. The engine is called a four-stroke engine because there are four movements (strokes) of the piston during one cycle. The brothers’ design was based on early automobile engine designs which used the Otto cycle, developed by the German, Dr. N. A. Otto, in 1876.
The brothers’ design is very simple by today’s standards, so it is a good engine for students to study to learn the fundamentals of engine operation. There are two main parts to engine operation: the mechanical operation of the engine parts, and the thermodynamics through which the engine produces work and power. On this page we will discuss the basic thermodynamic principles and on a separate page we present the thermodynamic analysis that allows you to design and predict engine performance.
Thermodynamics is a branch of physics which deals with the energy and work of a system. It was born in the 19th century as scientists were first discovering how to build and operate steam engines. Thermodynamics deals only with the large-scale response of a system which we can observe and measure in experiments. The basic ideas of thermodynamics are taught in high school physics classes, so the Wright brothers knew and used these concepts, particularly in their engine design.
Stages of the Otto Cycle
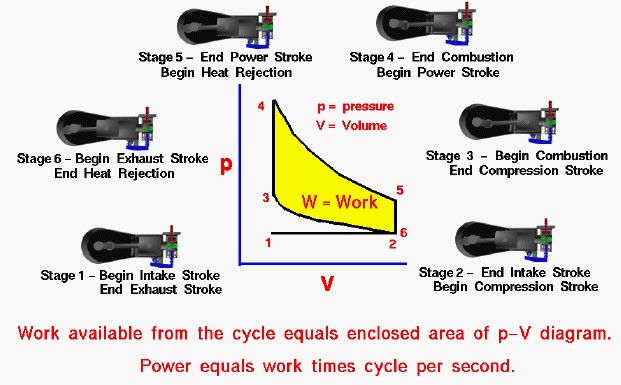
We have broken the Otto cycle into six numbered stages based on the mechanical operation of the engine. At each stage, we show a cut through the cylinder to reveal the movement of the piston and the amount of the gas volume created by the head of the piston and the cylinder to the right of the piston head. On the figure we show a plot of pressure versus gas volume throughout one cycle.
The cycle begins at the lower left with Stage 1 being the beginning of the intake stroke of the engine. The pressure is near atmospheric pressure and the gas volume is at a minimum with the piston far to the right in the cylinder. Between Stage 1 and Stage 2 the piston is moved to the left, the pressure remains constant, and the gas volume increases as fuel/air mixture is drawn into the cylinder through the intake valve (red).
Stage 2 begins the compression stroke of the engine with the closing of the intake valve. Between Stage 2 and Stage 3, the piston moves back to the right, the gas volume decreases, and the pressure increases because work is done on the gas by the piston.
Stage 3 is the beginning of the combustion of the fuel/air mixture. The combustion occurs very quickly and the volume remains constant. Heat is released during combustion which increases both the temperature and the pressure, according to the equation of state.
Stage 4 begins the power stroke of the engine. Between Stage 4 and Stage 5, the piston moves back to the left, the volume is increased, and the pressure falls as work is done by the gas on the piston.
At Stage 5 the exhaust valve (blue) is opened and the residual heat in the gas is exchanged with the surroundings. The volume remains constant, and the pressure adjusts back to atmospheric conditions.
Stage 6 begins the exhaust stroke of the engine during which the piston moves back to the right, the volume decreases and the pressure remains constant. At the end of the exhaust stroke, conditions have returned to Stage 1 and the process repeats itself.
During the cycle, work is done on the gas by the piston between stages 2 and 3. Work is done by the gas on the piston between stages 4 and 5. The difference between the work done by the gas and the work done on the gas is shown in yellow and is the work produced by the cycle. The work times the rate of the cycle (cycles per second) is equal to the power produced by the engine. The area enclosed by the cycle on a p-V diagram is proportional to the work produced by the cycle.
On this page we have shown an ideal Otto cycle in which there is no heat entering (or leaving) the gas during the compression and power strokes, no friction losses, and instantaneous burning occurring at constant volume. In reality, the ideal cycle does not occur and there are many losses associated with each process. These losses are normally accounted for by efficiency factors which multiply and modify the ideal result. For a real cycle, the shape of the p-V diagram is similar to the ideal, but the area (work) is always less than the ideal value.