Physics Modeling and Validation
Improvements in physical modeling and validation of those methods are critical to advancing numerical simulation capability.
Boundary Layer Bleed Modeling
The modeling of porous bleed boundary conditions was improved by scaling of sonic flow coefficient data for 90-degree bleed holes. This bleed model demonstrated good agreement with experimental data and three-dimensional computational fluid dynamics (CFD) simulations of bleed holes.
- Slater, J.W., “Improvements in Modeling 90 degree Bleed Holes for Supersonic Inlets,” NASA TM 2009-215597, Jun 2009. Also AIAA-2009-710.
- Slater, J.W., and Saunders, J.D., “Modeling of Fixed-Exit Porous Bleed Systems,” NASA TM 2008-215178, May 2008. Also AIAA-2008-0094.
Vortex Generator Modeling
![Comparison of Mach number contours on an axial slice downstream of gridded and modeled vortex generators. The contours indicate the counter-rotating vortex pair shed by the device.]](https://www1.grc.nasa.gov/wp-content/uploads/VGModel.png)
Including small-scale geometry details like vortex generators in a numerical simulation can be quite tedious and computationally expensive. Replacing those physical features with a modeled source term significantly aids preliminary design studies.
- Dudek, J.C., “Modeling Vortex Generators in a Navier-Stokes Code,” AIAA Journal, Vol. 40, No. 4, Apr 2011.
- Dudek, J.C., “Modeling Vortex Generators in the Wind-US Code,” NASA TM 2010-216744, Jul 2010. Also AIAA-2010-32.
Large Eddy Simulation (LES)
Scale resolving simulations are increasingly being used to improve the understanding and prediction of complex flow physics.
LES of a Hot Subsonic Jet

One example demonstrating how LES can be used to inform turbulence models is in the prediction of hot jets. In this work, the WRLES solution was validated against the individual velocity (v) and temperature (T) data. The LES was then used to compute the turbulent heat flux correlation (vT) since simultaneous measurement of both velocity and temperature at a single point is not practical. These results showed the inadequacy of the thermal gradient diffusion approximation used by most RANS turbulence models.
- DeBonis, J.R., “Prediction of Turbulent Temperature Fluctuations in Hot Jets,” NASA/TM-2017-219531, Jul 2017. Also AIAA-2017-3610.
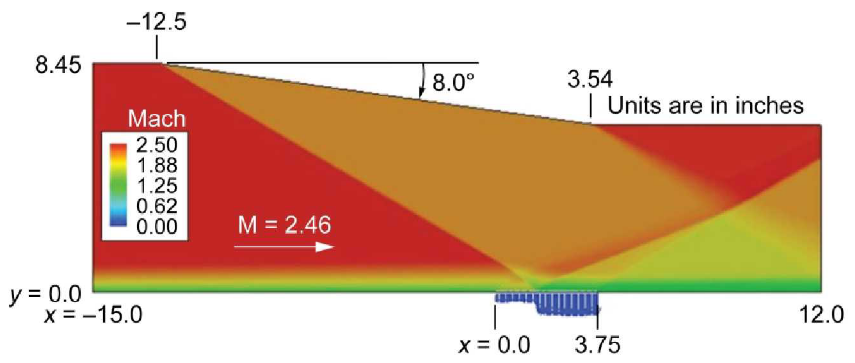
LES of a Shock-Wave Boundary-Layer Interaction (SWBLI)
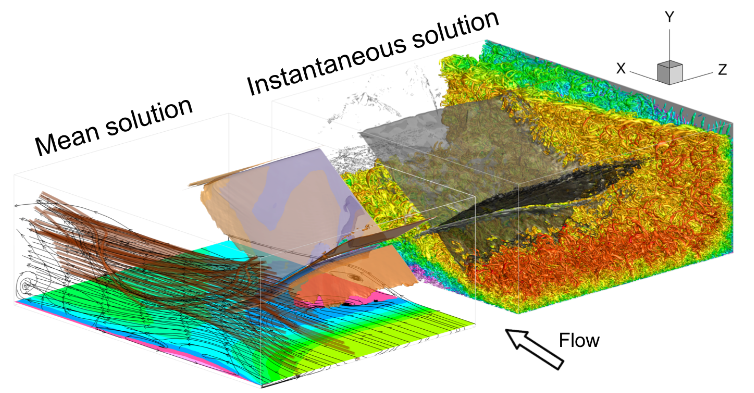
Another example demonstrating the complex flow physics being studied is the sidewall effects on an impinging shock-wave boundary-layer interaction. Statistics from this simulation with the FDL3DI solver will be used to inform turbulence models better.
- Vyas, M.A., et al., “Sidewall Effects on Exact Reynolds-Stress Budgets in an Impinging Shock Wave/Boundary Layer Interaction,” NASA/TM-2019-220143, Mar 2019. Also AIAA-2019-1890.
LES of a THX3 Single Cooling Hole Experiment

A third example is the FDL3DI and GFR simulations of the THX Phase III single cooling hole experiment described above. Again, in this case, velocity and temperature predictions were compared with the experiment. LES values of turbulent heat flux (vT) were then used to assess turbulence models.